Agenda
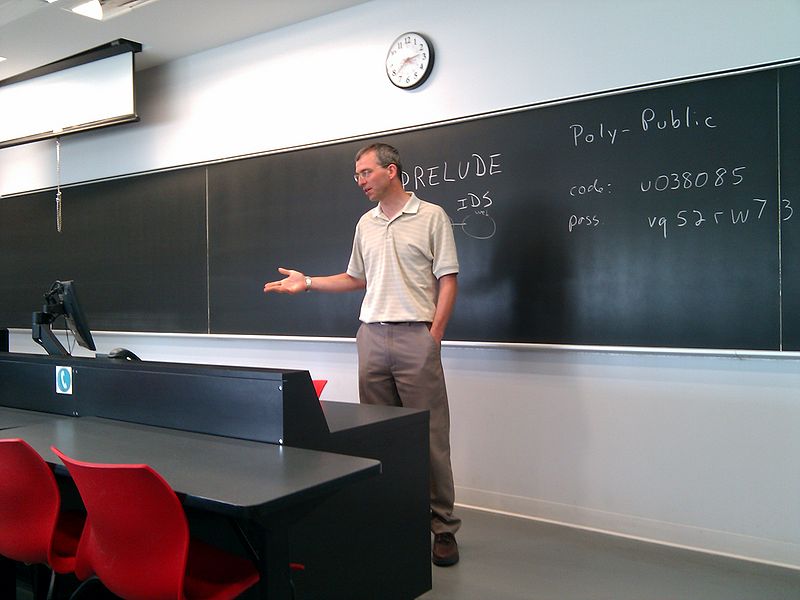
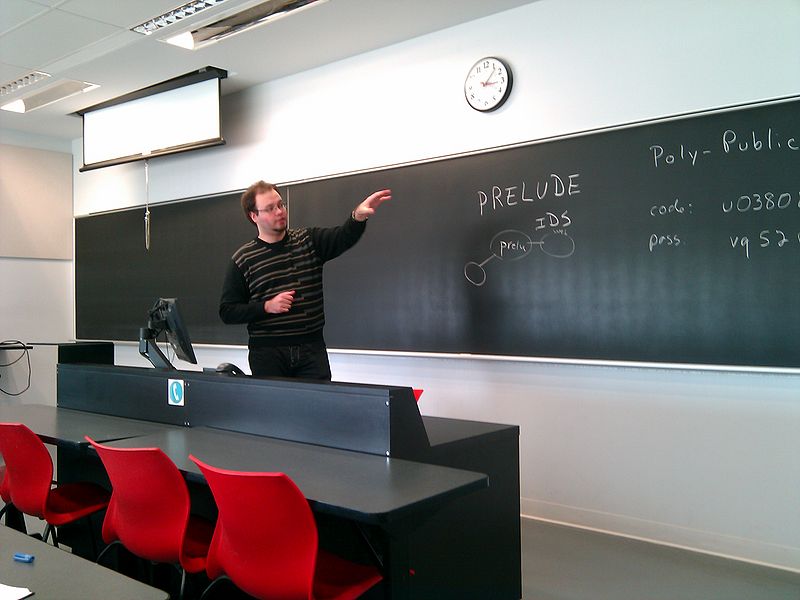
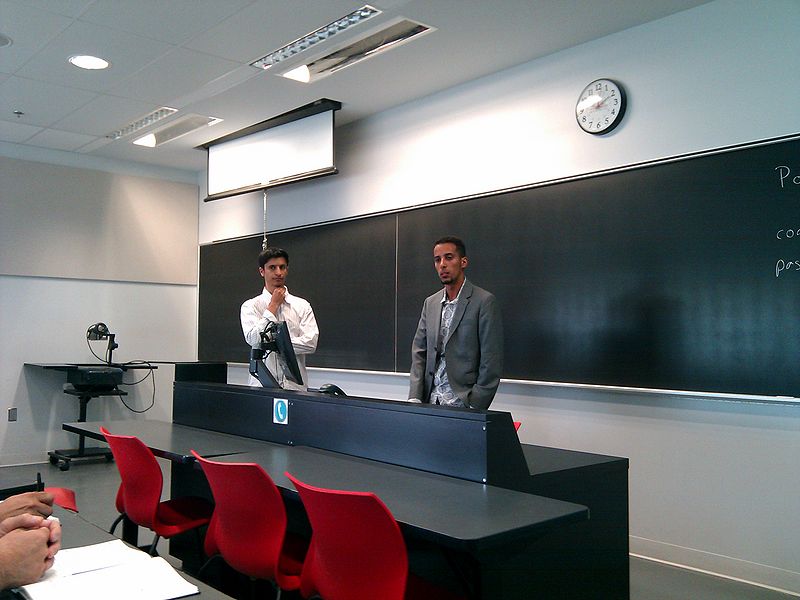
9:30 - 9:45 - Introduction
Mario Couture, Michel Dagenais and Dominique Toupin
Welcome and introduce the participants.
9:45 - 10:15 - Adaptative Fault Probing: Kernel tracing, LTTng mainlining, Standard trace format, Interoperability of static and dynamic tracing
Mathieu Desnoyers (slides), Rafik Fahem (slides), Michel Dagenais
Update on the ongoing work to mainline different parts of LTTng (ring buffer) and to get a consensus on a standard trace format. (Mathieu Desnoyers)
Quick comparison between perf, Ftrace, LTTng and GDB tracepoints in order to show the features offered by each for static and dynamic tracing. Discussion on how the features of each overlap or complement each other. (Rafik Fahem)
10:15 - 11h00 - Adaptative Fault Probing: User Space Tracing, Streaming, Multi-version trace reading/writing
Michael Sills-Lavoie (slides), David Goulet (slides), Alexis Hallé (slides), Oussama El Mfadli (slides), Matthew Khouzam (slides), Michel Dagenais
A short reminder of the streaming and remote control architecture (lttng-agent, lttng-client, and eclipse control plug-in) will be given followed by a description of the changes that occurred in the tools since December. We will also present the current state of the streaming and control framework to give an overview of what's working at the moment. Finally, we will talk about the future of these tools and what needs to be done in order for them to be fully functional.
(Michael Sills-Lavoie)
Profiling analysis of UST. Discussion of how to deploy UST in a production environment and upcoming challenges for UST. (David Goulet)
Presentation of the changes made to the UST daemon to allow the streaming of tracing data. (Alexis Hallé)
Discussion of the current work on the streaming of tracing data and the possibility to view it in real-time with the LTTV module. Modifications undertaken in the library and the text module will permit the live reading of a trace and its display. (Oussama El Mfadli)
A quick comparison of how to load trace files from multiple versions and the progress from LTTV to TMF. The presentation starts off showing how to open multiple version trace files in LTTV. Then the architecture of TMF will be shown and how it is used to be able to open multiple versions of a trace file. Finally the future of multi-version trace file reading will be discussed. (Matthew Khouzam)
11:00 - 11:45 - Multi-level Multi-core Distributed Traces Synchronisation: Traces Synchronisation, Tracing Kernel Virtual Machines (KVM) and Linux Containers (LXC), Dependency Analysis
Masoume Jabbarifar (slides), Julien Desfossez (slides), Michael Sills-Lavoie (slides), Michel Dagenais, Robert Roy
Multi-core processors in clusters may exhibit coherency problems when parallel programs access shared resources, thus creating hard to debug timing related problems. It is therefore crucial to have proper tools to monitor, trace and analyse system execution, in order to identify functional and performance problems. Global trace analysis, however, faces the problem that the cores of each computer of the cluster have their own clock not synchronised with all the others. LTTng is capable of handling huge traces of several gigabytes or more. However, a new architecture is required to handle huge traces while allowing the collection of traces from multiple systems and embedded devices, for both online and a posteriori off-line analysis and viewing. Moreover, the user of LTTng expects to see the output of real-time analysis to diagnose probable problems properly. Therefore, LTTng should be able to visualise traces from several distributed systems, on a common reference time base, in streaming mode. (Masoume Jabbarifar)
Recent advances in tracing the hypervisor and especially KVM. The main purpose of this work is to be
able to trace the system when the processor is running virtual machines, relating events and states to the KVM mode of operation.
One other aspect of this is also to trace processes in Linux Containers (LXC). (Julien Desfossez)
A short review of the existing work done by Pierre-Marc Fournier on the subject of dependency analysis, followed by a description of what we want to achieve in terms of user interface, integration into the TMF framework, dependency analysis between a host and a virtual machine and the dependency between machines in a distributed network. (Michael Sills-Lavoie)
11:45 - 12h15 - Trace abstraction, analysis and correlation
Waseem Fadel (slides), Abdelwahab Hamou-Lhadj
The objective of this talk is to report on our progress in developing trace abstraction techniques for system call traces generated from the Linux kernel. We will particularly focus on three main aspects: (a) the pattern library that we have developed to map high-level Linux kernel operations to low-level trace events, (b) the experiments we have conducted and in which we have applied the pattern library and the abstraction process to large execution traces, and (c) the Linux kernel trace abstraction tool. We will also discuss the remaining challenges and opportunities for future directions.
12:15 - 13:15 - Lunch Break
Lunch will be provided at Polytechnique
13:15 - 13:45 - Automated fault identification
Hashem Mohamed-Waly (slides) , Béchir Ktari
We present the syntax of a scenario description language and support our talk with a set of concrete problems to show the flexibility and the efficiency of the language. We will also present our progress in implementing the different parts of the project and integrating our plugins with Ericsson Eclipse plugins.
13:45 - 14:15 - Trace directed modeling
Hamoud Aljamaan, Sultan Eid (slides), Tim Lethbridge
We describe work currently underway, which includes developing an abstract language to model tracing needs; performing comprehensive reviews; studying the best infrastructure on which to base our work; and exploring reverse engineering from state machines. We will also describe our vision for what how engineers might use what we hope to create.
14:15 - 14:45 - System health monitoring and corrective measure activation: Detection, prediction, decision and reaction; a System Management Console prototype
Alireza Shameli (slides), Michel Dagenais
Nowadays, Cyber-attacks, overloading, and software/hardware failures are general problems in multi-core distributed systems. There are many security tools or system loggers that can be installed in distributed systems and monitor all events in the network. Security managers often have to process huge amounts of alerts per day produced by such tools. Anomaly analysis and reacting against it, are extremely difficult and an important part of security management. So we need to have some methods to optimize these alerts and design automated response strategies. The LTTng software provides the execution trace details of the Linux operating system. The Target Communication Framework (TCF) agent collects traces of multiple systems. After collecting all traces, we need a powerful tool to monitor the health of a large system continuously such that system anomalies can be promptly detected and handled appropriately. The main question in this research field is how anomalies in multi-core distributed systems can be detected, optimized, predicted, analysed and eventually prevented. So, developing software tools to monitor multi-core distributed systems, analyze system health, and activate response measures in case of problem is our objective.
14:45 - 15:15 - Break
15:15 - 15:45 - Tracing and Monitoring Framework Impact Prediction: Tracing impact, State history storage
Douglas Santos (slides), Alexandre Montplaisir (slides), Michel Dagenais
Users need to measure the impact of tracing on large production multi-core distributed systems. To accomplish this we will propose a model that will estimate the impact of requesting more traces on these systems. This is a short presentation that will explain what has already been done on this area and the short term plans.
(Douglas Santos)

The current state storage mechanism works adequately for small servers, but will have space overhead problems with huge traces on large, busy, servers. A new system is being designed, in which we store the state history in intervals, which are then inserted in a disk-based tree. Since we avoid redundant information, this should allow for a linear disk space usage while keeping the queries efficient even with a large number of events.
This presentation will briefly explain the workings of this new system, how it will integrate with the current trace visualizers, and show the results of some very preliminary performance testing. (Alexandre Montplaisir)
15:45 - 16:15 - The Eclipse Tracing and Monitoring Framework
Francois Chouinard (slides)
Presentation on the latest developments for the Eclipse Tracing and Monitoring Framework. Discussion of upcoming plans.
16:15 - 17:00 - Conclusion
Mario Couture, Michel Dagenais and Dominique Toupin
Interact with the participants to obtain feedback on the results so far and on the plans for further work.
| Attachment | Size |
|---|---|
| 1.03 MB | |
| 618.36 KB | |
| 275.52 KB | |
| 190.21 KB | |
| 54.2 KB | |
| 407.25 KB | |
| 152.15 KB | |
| 1.95 MB | |
| 434.91 KB | |
| 417.48 KB | |
| 505.08 KB | |
| 459.73 KB | |
| 1.67 MB | |
| 990.53 KB | |
| 370.72 KB | |
| 127.5 KB | |
| 156.96 KB | |
| 990.53 KB | |
| 62.43 KB | |
| 51.55 KB | |
| 53.11 KB |
