Day 1 - State of the Art Presentations (Room M-2002)
9:45 - 10:00 Introduction
Mario Couture, Michel Dagenais and Dominique Toupin
Welcome and introduce the participants. Present the agenda.
10:00 - 11:00 - Adaptative Fault Probing
Michel Dagenais and Mathieu Desnoyers (slides)
Adaptative fault probing is the base infrastructure to efficiently insert tracepoints at compilation and execution time, dynamically activate these tracepoints, and retrieve the tracing data. For whole system tracing, the tracepoints may be inserted in any layer, from hypervisor to operating system, virtual machine, system library and applications. The objective is the ability to trace with minimal disturbance any significant event in a distributed multi-core system: a low overhead, high throughput, whole system wait-free tracing infrastructure.
The presentation will describe the existing tracing systems, such as SystemTap, DTrace, Kprobe and Utrace. Thereafter, the latest progress in kernel and user-space tracing developed as part of this project, in collaboration with the FTrace kernel developers, IBM, Ericsson Software Research, Red Hat, Fujitsu and others will be presented. New algorithms for wait-free kernel trace burrefing were proposed and are being integrated into the mainline Linux kernel. Furthermore, a new user space Read-Copy Update algorithm for atomic updates in user space was proposed and used to develop an extremely efficient user-space tracing solution that is both highly-scalable to multiple cores and accepts tracepoints even in asynchronous signal handlers. The result is a complete low disturbance infrastructure for system wide tracing. The performance of this new infrastructure will be presented and compared to existing solutions such as DTrace and SystemTap. Finally, the possible interactions between this wait-free buffering scheme, initially targeted at static tracepoints, and dynamic tracepoints will be discussed. This includes Kprobe tracepoints, GDB tracepoints and SystemTap.
11:00 - 12:00 - Multi-level Multi-core Distributed Traces Synchronization
Robert Roy, Michel Dagenais, Benjamin Poirier (slides) and Masoume Jabbarifar
Traces synchronization is required to compute a common time base for all the traces collected on the multiple cores of multiple systems in a distributed multi-core system. Once all the events in these traces are brought to a common time base, it enables whole system trace analysis.
The presentation will first concentrate on methods for identifying reliably and efficiently events in distributed traces that correspond to sending and receiving the same packet across the network. Then, different algorithms will be described and compared to estimate the most likely clock drift between distributed systems based on several packets identified in traces. Thereafter, the clocks synchronization characteristics between multiple cores and between physical and virtual machines will be described for several existing advanced and upcoming system architectures and virtualization systems. The implementation of the clock drift estimation module will be detailed. The architecture planned for integrating distributed, multi-level (kernel, physical and virtual machines, system libraries and applications) trace sources into a live trace visualization and analysis framework will be presented and discussed.
12:00 - 13:00 - Lunch Break
Lunch will be provided at Polytechnique.
13:00 - 14:00 - Trace abstraction, analysis and correlation
Abdelwahab Hamou-Lhadj and Waseem Fadel (slides)
The objective of trace abstraction is to replace several low-level events (e.g. disk blocks read requests, disk controller interrupts) by fewer high-level events (e.g. reading a file) in order to simplify the subsequent analysis of distributed multi-core execution traces. As a result, by abstracting low-level details, it should be easier to verify the correlation between two redundant systems executing the same commands, or between different releases of the same software. When significant differences are found, this may indicate an intrusion in one of the two redundant systems, or an error introduced in a software release.
Many trace abstraction techniques have been proposed in the literature of software engineering. These techniques vary significantly in their design depending on the type of traces on which they are applied (e.g. routine call traces, statement-level traces, etc.). In this talk, we will present the state of the art knowledge in the area of trace abstraction and analysis and discuss if and how existing techniques can be applied to extract higher level abstractions from low-level, event-based, system call traces generated from distributed multi-core Linux systems.
14:00 - 15:00 - Automated fault identification
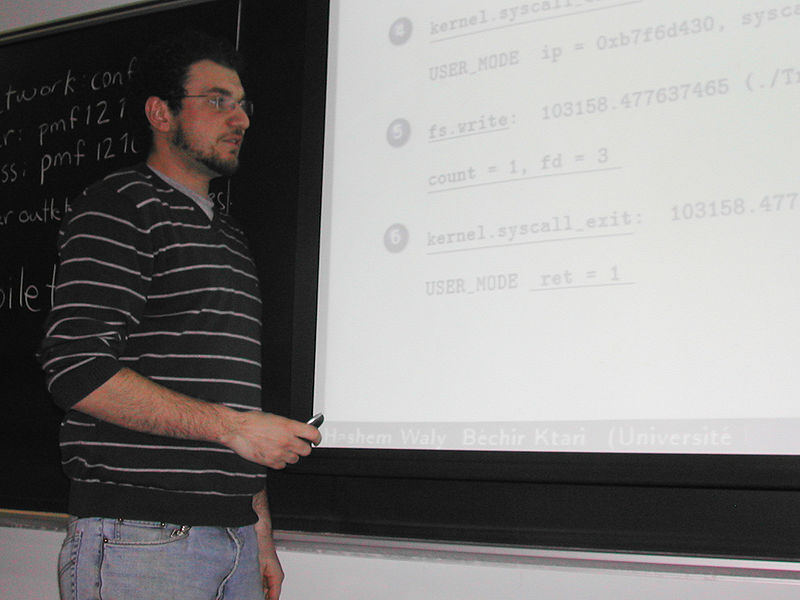
Béchir Ktari and Hashem Mohamed-Waly (slides)
The objective of automated fault identification is to have an efficient system to describe fault patterns and verify automatically large execution traces against an extensible fault pattern dictionary. This may be used either to detect ongoing cyber-attacks or intrusions, or to rapidly identify common performance or programming problems.
The state of the art will be presented for the various languages that may be used to describe different fault patterns visible in execution traces. Their expressiveness, potential for performance, and applicability to detect a wide range of problems will be compared. Various abnormal activities in the fields of security, performance, and software correctness in multi-core and distributed systems will be presented, along with the relevant information in LTTng traces. The properties needed in the pattern description language to describe efficiently these abnormal activities will be discussed. The state of the art presentation will examine existing systems in the areas of Intrusion Detection, System Tracing and System Surveillance.
15:00 - 15:15 - Break
15:15 - 16:15 - Trace directed modeling
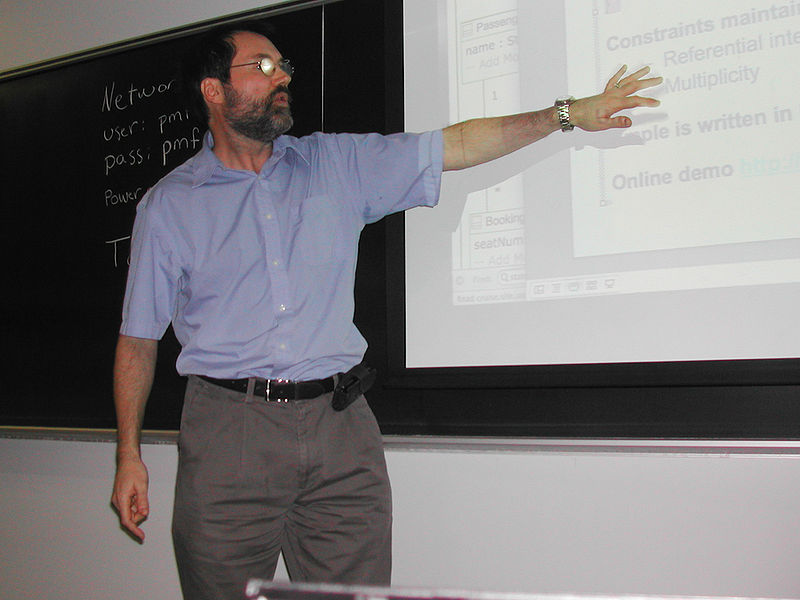
Timothy Lethbridge (slides)
The objective of this track is to connect high level models with low level tracing tools. Low level events represent actions which may be correlated with high level state transitions, thus enabling the display of the execution trace at the UML modeling level.
This state of the art presentation looked at current approaches to verification and analysis using state machines, reverse engineering from traces, state machine generation and modeling and the Umple language which we intend to use as both a target for reverse engineering and a platform for experimenting with tracepoints and traceability from models.
16:15 - 17:15 - System health monitoring and corrective measure activation
Michel Dagenais and Alireza Shameli (slides)
Once detailed execution traces for distributed multi-core systems are available, further processing abstracts low-level events into high-level events, measures different usage and performance metrics, detects known fault patterns, and looks for correlation or deviation from known good systems. As a result, high level information becomes available about the system health. The objective of system health monitoring is to determine and display the system health, trigger additional information collection through tracing if a problem in some area is suspected, and trigger corrective measures if a serious problem is found. Examples of corrective measures include limiting the resources consumed by some users to protect the quality of service for critical functions, adapting the firewall configuration when a system is under cyber-attack, or disconnecting a redundant system suspected of being compromised.
This state of the art presentation will first examine the standard formats to document various properties of systems (security configuration description, security common criteria certification) cyber-attacks (intrusion detection messages definition) and other aspects (security automation). Then, existing systems to monitor large networks, diagnose misbehaving systems and automatically react to changing conditions will be described and discussed.
17:15 - 17:45 - Conclusion
Mario Couture, Michel Dagenais and Dominique Toupin
Interact with the participants to obtain feedback on the results so far and on the plans for further work.
| Attachment | Size |
|---|---|
| 6.89 MB | |
| 1.72 MB | |
| 4.58 MB | |
| 1.39 MB | |
| 1 MB | |
| 216.87 KB | |
| 246.5 KB | |
| 755 KB | |
| 933.34 KB | |
| 104.93 KB | |
| 53.55 KB | |
| 61.57 KB |